
JIT watch introduction
In the previous blog post, we measured the effect of basic JIT optimisation technique – method inlining(out of other JIT optimisation techniques). The code example was a bit unnatural as it was super simple Scala code just for demonstration purposes of method inlining. In this post, I would like to share a general approach I am using when I want to check how JIT treats my code or if there is some possibility to improve the code performance in regards to JIT. Even the method inlining requires the code to meet certain criteria as bytecode length of inlined methods etc. For this purpose, I am regularly using great OpenJDK project called JITWatch which comes with a bunch of handy tools in regard to JIT. I am pretty sure that there is probably more tools and I will be more than happy if you can share your approaches when dealing with JIT in the comment section below the article.
Java HotSpot JITWatch configurations
Java HotSpot is able to produce a very detailed log of what the JIT compiler is exactly doing and why. Unfortunately, the resulting log is very complex and difficult to read. Reading this log would require an understanding of the techniques and theory that underline JIT compilation. A free tool like JITWatch process those logs and abstract this complexity away from the user.
In order to produce log suitable for JIT Watch investigation the tested application needs to be run with following JVM flags:
-XX:+UnlockDiagnosticVMOptions

-XX:+LogCompilation

-XX:+TraceClassLoading
those settings will produce log file hotspot_pidXXXXX.log. For purpose of this article, I re-used code from the previous blog located on my GitHub account with JVM flags enabled in build.sbt.
In order to look into generated machine code in JITWatch we need to install HotSpot Disassembler (HSDIS) to install it to $JAVA_HOME/jre/lib/server/. For Mac OS X that can be used from here and try renaming it to hsdis-amd64-dylib. In order to include machine code into generated JIT log we need to add JVM flag -XX:+PrintAssembly.
[info] 0x0000000103e5473d: test %r13,%r13
[info] 0x0000000103e54740: jne 0x0000000103e5472a
[info] 0x0000000103e54742: mov $0xfffffff6,%esi
[info] 0x0000000103e54747: mov %r14d,%ebp
[info] 0x0000000103e5474a: nop
[info] 0x0000000103e5474b: callq 0x0000000103d431a0 ; OopMap{off=112}
[info] ;*invokevirtual inc
[info] ; - com.jaksky.jvm.tests.jit.IncWhile::testJit@12 (line 19)
[info] ; {runtime_call}
[info] 0x0000000103e54750: callq 0x0000000102e85c18 ;*invokevirtual inc
[info] ; - com.jaksky.jvm.tests.jit.IncWhile::testJit@12 (line 19)
[info] ; {runtime_call}
[info] 0x0000000103e54755: xor %r13d,%r13d
JITWatch
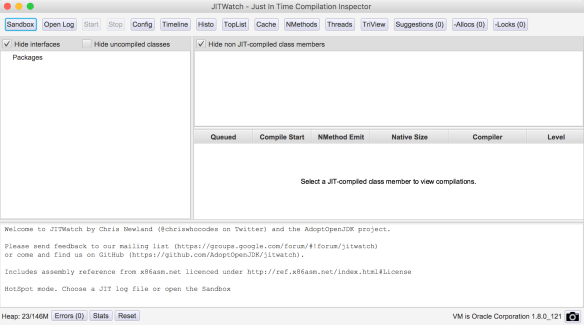
We run the JITWatch via ./launchUI.sh
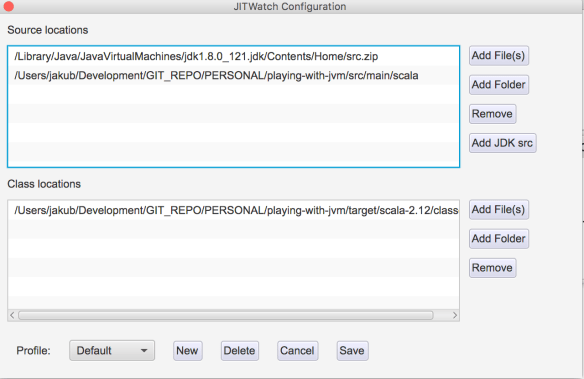
to configure source files and target generated class files
And finally, open prepared JIT log and hit Start.
The most interesting from our perspective is TriView where we can see the source code, JVM bytecode and native code. For this particular example we disabled method inlining via JVM Flag “-XX:CompileCommand=dontinline, com/jaksky/jvm/tests/jit/IncWhile.inc“
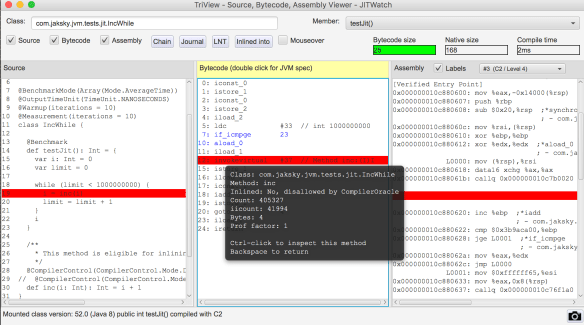
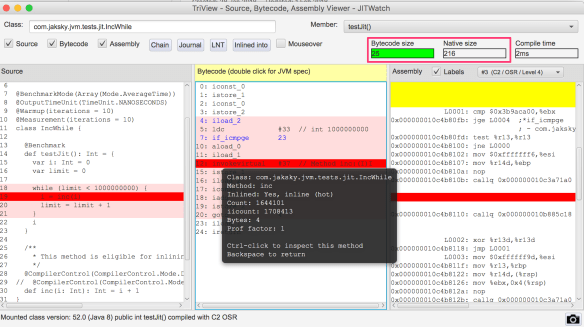
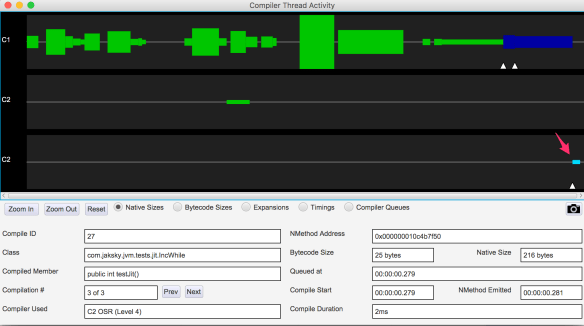
To just compare with the case when the method body of IncWhile.inc is inlined – native code size is greater 216 compared to 168 with the same bytecode size.
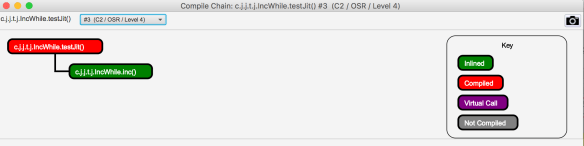
Compile Chain provides also a great view of what is happening with the code
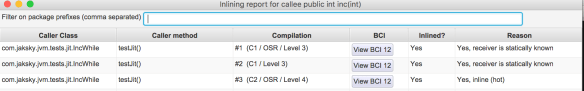
Inlining report provides a great overview what is happening with the code
As it can be seen the effect of tiered compilation as described in JIT compilation starts with client C1 JIT compilation and then switches to server C2 compilation. The same or even better view can be found on Compiler Thread activity which provides a timeline view. To refresh memory check overview of JVM threads. Note: standard java code is subject to JIT optimizations too that’s why so many compilation activities here.
JITWatch is a really awesome tool and provides many others views which don’t make sense to screenshot all e.g. cache code allocation, nmethodes etc. For detail information, I really suggest reading JITWatch wiki pages. Now the question is how to write JIT friendly code? Here pure jewel of JITWatch comes in: Suggestion Tool. That is why I like JITWatch so much. For demonstration, I selected somewhat more complex problem – N Queens problem.
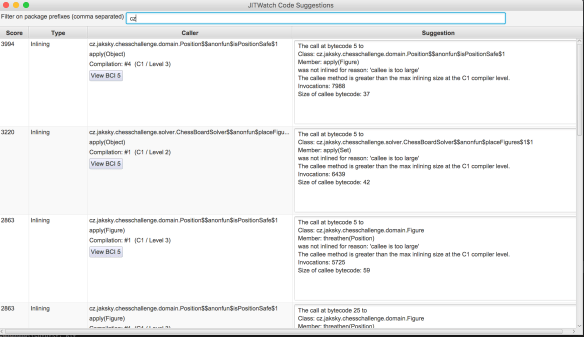
Suggestion tool clearly describes why certain compilations failed and what was the exact reason. It is a coincidence that in this example we hit again just inlining as there is definitely more going on in JIT but this window provides a clear view of how we can possibly help JIT.
Another great tool which is also a part of JITWatch is JarScan Tool. This utility will scan a list of jars and count bytecode size of every method and constructor. The purpose of this utility is to highlight the methods that are bigger than HotSpot threshold for inlining hot methods (default 35 bytes) so it provides hints where to focus benchmarking to see whether decomposing code into smaller methods brings some performance gain. The hotness of the method is determined by the set of heuristics including call frequency etc. But what can eliminate the method from inlining is its size. For sure just the method size it too big breaching some limit for inlining doesn’t automatically mean that method is a performance bottleneck. JarScan tool is a static analysis tool which has no knowledge of runtime statistics hence real method hotness.
jakub@MBook ~/Development/GIT_REPO (master) $ ./jarScan.sh --mode=maxMethodSize --limit=35 ./chess-challenge/target/scala-2.12/classes/
"cz.jaksky.chesschallenge","ChessChallange$","delayedEndpoint$cz$jaksky$chesschallenge$ChessChallange$1","",1281
"cz.jaksky.chesschallenge.solver","ChessBoardSolver$","placeFigures$1","scala.collection.immutable.List,scala.collection.immutable.Set",110
"cz.jaksky.chesschallenge.solver","ChessBoardSolver$","visualizeSolution","scala.collection.immutable.Set,int,int",102
"cz.jaksky.chesschallenge.domain","Knight","check","cz.jaksky.chesschallenge.domain.Position,cz.jaksky.chesschallenge.domain.Position",81
"cz.jaksky.chesschallenge.domain","Queen","equals","java.lang.Object",73
"cz.jaksky.chesschallenge.domain","Rook","equals","java.lang.Object",73
"cz.jaksky.chesschallenge.domain","Bishop","equals","java.lang.Object",73
"cz.jaksky.chesschallenge.domain","Knight","equals","java.lang.Object",73
"cz.jaksky.chesschallenge.domain","King","equals","java.lang.Object",73
"cz.jaksky.chesschallenge.domain","Position","Position","int,int",73
"cz.jaksky.chesschallenge.domain","Position","equals","java.lang.Object",72
Conclusion
To wrap up, JITWatch is a great tool which provides insight into HotSpot JIT optimisations happening during program execution and it can help you to understand how a decision made at the source code level can affect the performance of the program. If you want to share your experience and tips please find comment section below or find me on twitter

Pingback: Structure of Java Virtual Machine (JVM) | JVM & Software development
Pingback: HotSpot JVM JIT optimisation techniques | JVM & Software development