
JVM Internals
Previous article structure of JVM – java memory model briefly mentions bytecode executions modes and article JVM internal threads provides additional insight into the internal architecture of JVM execution. In this article, we focus on Just In Time compilation and on some of its basic optimisation techniques. We also discuss the performance impact of one JIT optimisation technique namely method inlining. In the remainder of this article we focus solely on HotSpot JVM, however, principles are valid in general.
HotSpot Java jvm internals
HotSpot JVM is a mixed-mode VM which means that it starts off interpreting the bytecode, but it can compile code into very highly optimised native machine code for faster execution. This optimised code runs extremely fast and performance can be compared with C/C++ code. JIT compilation happens on method basis during runtime after the method has been run a number of times and considered as a hot method. The compilation into machine code happens on a separate JVM thread and will not interrupt the execution of the program. While the compiler thread is compiling a hot method JVM keeps on using the interpreted version of the method until the compiled version is ready. Thanks to code runtime characteristics HotSpot JVM can make a sophisticated decision about how to optimise the code.
hotspot jit
Java HotSpot VM is capable of running in two separate modes (C1 and C2) and each mode has a different situation in which it is usually preferred:
- C1 (-client) – used for application where quick startup and solid optimization are needed, typically GUI application are good candidates.
- C2 (-server) – for long running server application
Those two compiler modes use different techniques for JIT compilation so it is possible to get for the same method very different machine code. Modern java application can take advantage of both compilation modes and starting from Java SE 7 feature called tiered compilation is available.
java compilethreshold
An application starts with C2 compilation which enables fast startup and once the application is warmed up compiler C2 takes over. Since Java SE 8 tiered compilation is a default. Server optimisation is more aggressive based on assumptions which may not always hold. These optimizations are always protected with guard condition to check whether the assumption is correct. If an assumption is not valid JVM reverts the optimisation and drops back to interpreted mode. In server mode HotSpot VM runs a method in interpreted mode 10 000 times before compiling it (can be adjusted via
-XX:CompileThreshold=5000). Changing this threshold should be considered thoroughly as HotSpot VM works best when it can accumulate enough statistics in order to make an intelligent decision what to compile. If you wanna inspect what is compiled using-XX:PrintCompilation.Other JIT techniques
Among most common JIT compilation techniques used by HotSpot VM is method inlining, which is a practice of substituting the body of a method into the places where the method is called. This technique saves the cost of calling the method. In the HotSpot, there is a limit on method size which can be substituted. Next technique commonly used is monomorphic dispatch which relies on a fact that there are paths through method code which belongs to one reference type most of the time and other paths that belong to other types. So the exact method definitions are known without checking thanks to this observation and the overhead of virtual method lookup can be eliminated. JIT compiler can emit optimised machine code which is faster. There are many other optimisation techniques like loop optimisation, dead code elimination, intrinsics and others.
The performance gain by inlining optimisation can be demonstrated on a simple Scala code:
class IncWhile {

  def main(): Int = {
    var i: Int = 0
    var limit = 0

    while (limit < 1000000000) {
      i = inc(i)
      limit = limit + 1
    }
    i
  }

  def inc(i: Int): Int = i + 1
}
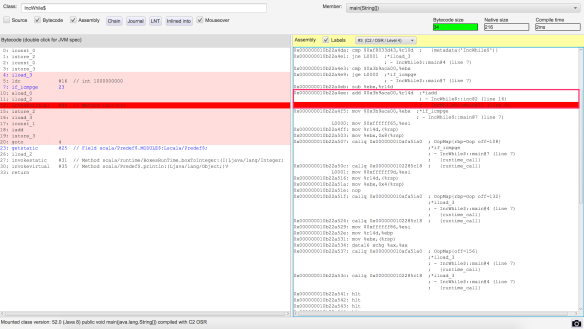
JIT watch
Where method inc is eligible for inlining as the method body is smaller than 35 bytes of JVM bytecode (actual size of inc method is 9 bytes). Inlining optimisation can be verified by looking into JIT optimised machine code.
Difference is obvious when compared to machine code when inlining is disabled use –XX:CompileCommand=dontinline,com/jaksky/jvm/tests/jit/IncWhile.inc
 The difference in runtime characteristics is also significant as the benchmark results show. With disabled inlining:
[info] Result "com.jaksky.jvm.tests.jit.IncWhile.main":
[info] 2112778741.540 ±(99.9%) 9778298.985 ns/op [Average]
[info] (min, avg, max) = (2040573480.000, 2112778741.540, 2192003946.000), stdev = 28831537.237
[info] CI (99.9%): [2103000442.555, 2122557040.525] (assumes normal distribution)
[info] # Run complete. Total time: 00:08:03
[info] Benchmark Mode Cnt Score Error Units
[info] IncWhile.main avgt 100 2112778741.540 ± 9778298.985 ns/op
When inlining enabled JVM JIT also capable to use next optimizations like loop optimizations which might case that our whole loop is eliminated as it is easily predictable. We would get time around 3 ns which are for 1GHz processor unreal to perform billions of operations. To disable most of loop optimizations use -XX:LoopOptsCount=0 JVM option.
[info] Result "com.jaksky.jvm.tests.jit.IncWhile.main": [info] 332699064.778 ±(99.9%) 3485503.823 ns/op [Average] [info] (min, avg, max) = (316312877.000, 332699064.778, 358738827.000), stdev = 10277087.396 [info] CI (99.9%): [329213560.955, 336184568.600] (assumes normal distribution) [info] # Run complete. Total time: 00:04:55 [info] Benchmark Mode Cnt Score Error Units [info] IncWhile.main avgt 100 332699064.778 ± 3485503.823 ns/opso the performance gain by inlining a method body can be quite significant 2 seconds vs 300 milliseconds.Conclusion
In this post, we discussed the mechanics of Java JIT compilation and some optimisation techniques used. We particularly focused on the one of the simplest optimisation technique called method inlining. We demonstrated performance gain brought by eliminating a method call represented by invokevirtual bytecode instruction. Scala also offers a special annotation @inline which should help us with performance aspects of the code under the development. All the code for running the experiments is available online on my GitHub account.

Pingback: HotSpot JVM internal threads | JVM & Software development
“Application starts with C2 compilation which enables fast startup and once the application is warmed up compiler C2 takes over.”
You mean start with C1 and C2 takes over?
LikeLike
Yes, more detail mechanics can be found https://docs.oracle.com/javase/7/docs/technotes/guides/vm/performance-enhancements-7.html#tieredcompilation
LikeLike
Pingback: How to optimise a code to be JIT friendly | JVM & Software development
Pingback: Structure of Java Virtual Machine (JVM) | JVM & Software development
Pingback: HotSpot JVM JIT optimisation techniques | JVM & Software development